Most health plans track denial rates. Very few have calculated what bad provider data specifically costs them across the full revenue cycle, from the first claim submission through rework, appeals, overpayments, and FTE burden. The number is almost always larger than anyone expects.
And the trend line is not going in the right direction.
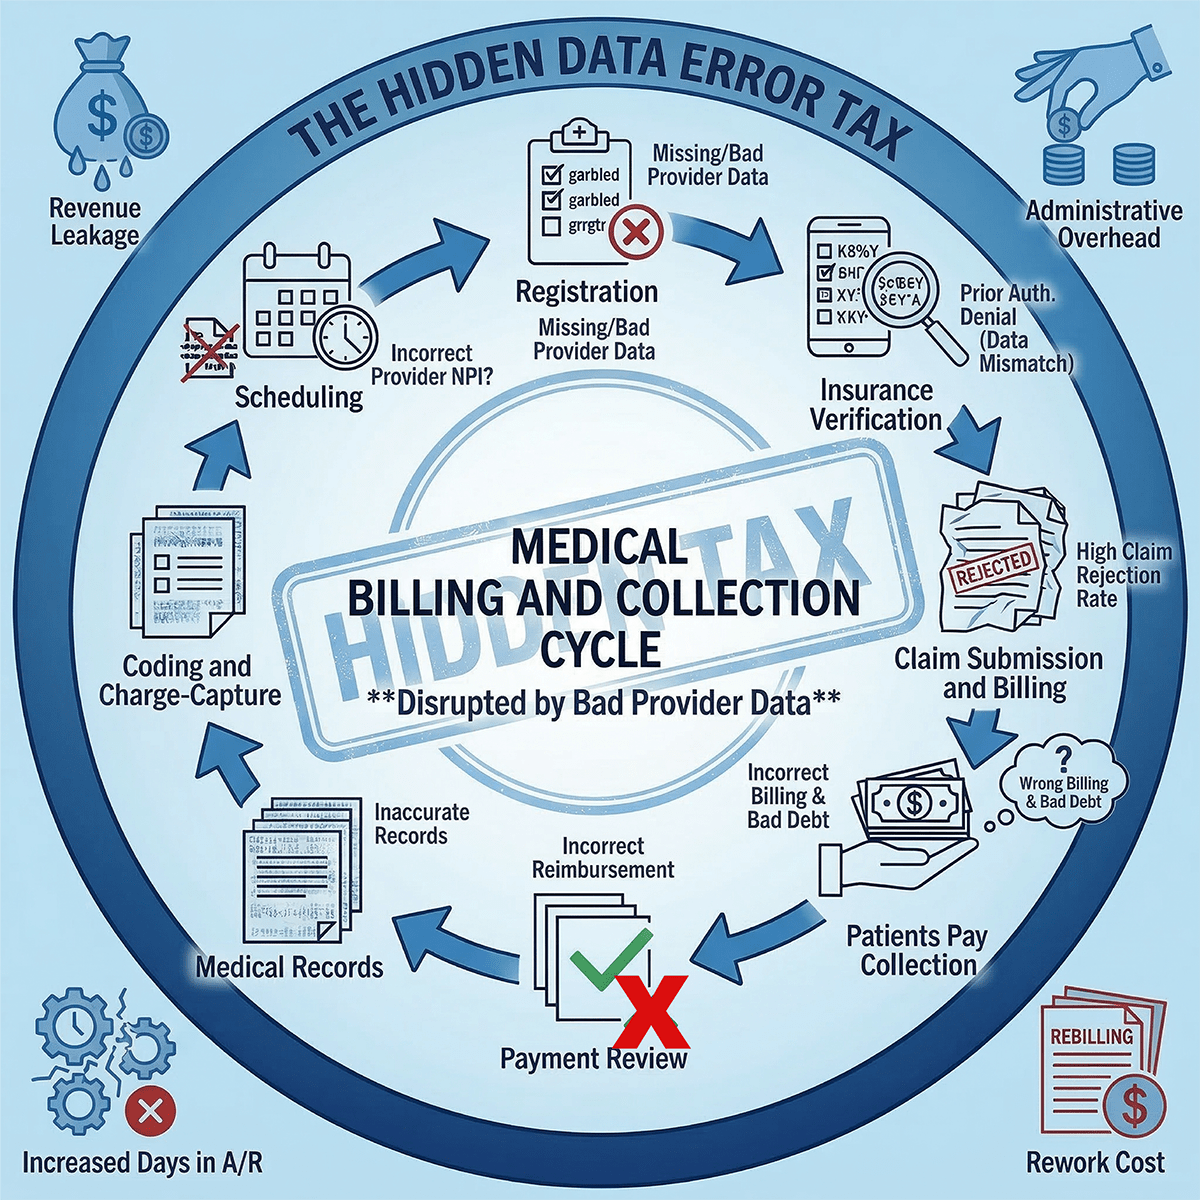
The Denial Rate Crisis Has a Root Cause
Denial rates have climbed to 11.8% and are rising year over year, according to Experian Health’s 2025 State of Claims report. That number doesn’t represent random variation or payer arbitrariness. It represents something structural, something upstream, something correctable.
Provider data errors are a primary driver. Incorrect NPIs, mismatched taxonomy codes, outdated network status, wrong service locations: these are not edge cases. HFMA research identifies provider ineligibility and credentialing errors as consistently ranking among the top causes of claim denials, alongside prior authorization and coding issues. A separate analysis found that roughly 54% of medical practices report denials tied specifically to provider credentialing and enrollment problems. With AHIMA confirming that approximately 90% of denials are preventable, even a conservative estimate of provider-data-driven denials as a share of the $25.7 billion annual rework burden places the avoidable cost in the billions every year.
That’s not a claims operations number. That’s a data infrastructure number.
$25.7 Billion and Climbing
The Premier Inc. 2025 survey on claims adjudication put the total industry cost of denied claims at $25.7 billion, a 23 percent increase in a single year. The finding that should stop every CFO mid-sentence: 70 percent of those denied claims were ultimately paid on appeal.
The system is spending billions to adjudicate claims that should never have been denied. Most of those denials were not the result of fraud, complex clinical decisions, or legitimate coverage disputes. They were the result of incorrect or missing provider data triggering automated rejections in adjudication systems that had no way to recognize the error.
The Per-Denial Math Is Getting Worse
The administrative cost to process a single denied claim rose from $43.84 in 2022 to $57.23 in 2023, according to Premier and Aptarro data. That’s a 30 percent increase in one year. Apply that number to the denial volume at even a mid-sized regional health plan, and the result is a line item that belongs in the boardroom, not buried in operations reports.
For context: a plan processing 500,000 claims annually with a 10 percent denial rate generates 50,000 denied claims. At $57.23 per denial, that’s $2.86 million in administrative cost for denials alone, before a single appeal, before any rework, before accounting for the claims that are never resubmitted at all.
The Labor Multiplier
The cost calculation doesn’t stop at the denial. It compounds through the workforce.
Approximately 15 to 20 percent of claims still require manual processing, according to HealthEdge research on auto-adjudication rates. Each of those manually processed claims consumes 10 to 24 minutes of staff time (CAQH Index). And manual processing now accounts for roughly 90 percent of total claims processing expense, per Aptarro’s 2026 analysis.
That is not a workflow inefficiency. That is what happens when the underlying data cannot be trusted to drive automated decisions. When provider identity is unclear, when network status is uncertain, when taxonomy codes don’t match the credentialing system, claims fall out of auto-adjudication and into queues. Those queues are staffed by humans at a cost that dwarfs any subscription to a data quality platform.
Revenue That Never Comes Back
Perhaps the most damaging number in this analysis: between 35 and 60% of denied claims are never resubmitted (Aptarro). Every one of those represents legitimate revenue that walked out the door not because the claim was invalid, but because the organization lacked the operational bandwidth or the institutional will to fight a denial that should never have happened.
That’s not a collections problem. That’s a provider data problem with a permanent revenue consequence.
Reframing the Cost Category
The conventional framing treats these as claims operations costs. They show up in claims processing budgets, denial management programs, and revenue cycle performance dashboards. But that framing obscures the root cause.
When your adjudication system doesn’t know who a provider is, where they practice, whether they’re in-network, or whether their taxonomy code matches your contracted specialty, the revenue cycle absorbs the cost. Every day. Across every claim that touches a provider record that hasn’t been validated.
These are provider data infrastructure costs wearing a claims operations uniform. The budget category is wrong. The owner is wrong. The solution being purchased is wrong.
Until the infrastructure is right, no amount of denial management investment will close the gap. You cannot appeal your way out of a data quality problem at scale.
What “Getting It Right” Actually Means
Polus™ HCP was built on the premise that provider data should be continuously validated, not periodically cleaned. The distinction matters because provider information changes constantly. Addresses change. Network status changes. Taxonomy codes get updated. Affiliations shift.
A quarterly cleanup cycle means your data is already out of date by the time the project closes. An annual review means you’re running your revenue cycle on information that may be a year stale.
Continuous validation, driven by automated ingestion, AI-assisted identity resolution, and real-time reconciliation against authoritative sources, is the only architecture that matches the pace at which provider data actually changes. When that infrastructure is in place, the denial rate drops. The manual queue shrinks. The FTE burden decreases. The revenue that used to walk out the door as uncontested denials stays in the system.
The math on provider data infrastructure isn’t complicated. The question is whether your organization is accounting for the full cost of not having it.
Think you know the true cost of bad provider data? Let us show you. Schedule a 30-minute Strategy Session. No product demo. No sales pitch. Just a working conversation about your current data posture, verification cadence, ingestion workflows, and compliance exposure.
We also invite you to learn more through Datagence or these key third-party sources:
- Datagence: Why Provider Directories Fail (And Always Have)
- Datagence: The Provider Data Enforcement Reckoning
- Experian Health 2025 State of Claims
- Premier Inc. Claims Adjudication Survey (2025)
- Aptarro: 50+ US Healthcare Denial Rates & Reimbursement Statistics for 2026
- HealthEdge on auto-adjudication